Surface Roughness Sampling
Soil surface roughness affects both the radiometric and radar observations. Radar observations can, in certain conditions, be more sensitive to surface roughness than soil moisture itself due to the increased scattering of the incoming radiation. Moreover, surface roughness affects the radiometric observations by effectively increasing the surface area of electromagnetic wave emission. Its effect on observations at L-band frequency has been difficult to quantify, and therefore it is crucial to characterise the spatial variation of this parameter across the different land cover types.
Surface roughness sampling during SMAPEx-2 was concentrated in the six 3km x 3km focus areas where intensive soil moisture sampling was undertaken. Surface roughness was characterized at a minimum of 1 (aiming at 3 locations) within each major land cover type in each focus area. At each location, two 3m-long surface profiles were recorded, one oriented parallel to the look direction of the PLIS radar (East-west) and one perpendicular to it (north-south). Research has shown that 3m profiles provide a stable estimate of the correlation length.
Surface roughness sampling followed closely the vegetation sampling schedule and approach, as both were performed by the vegetation team. Complete details on the surface roughness sampling strategy and protocols can be found in the SMAPEx-2 workplan and workplan addendum.
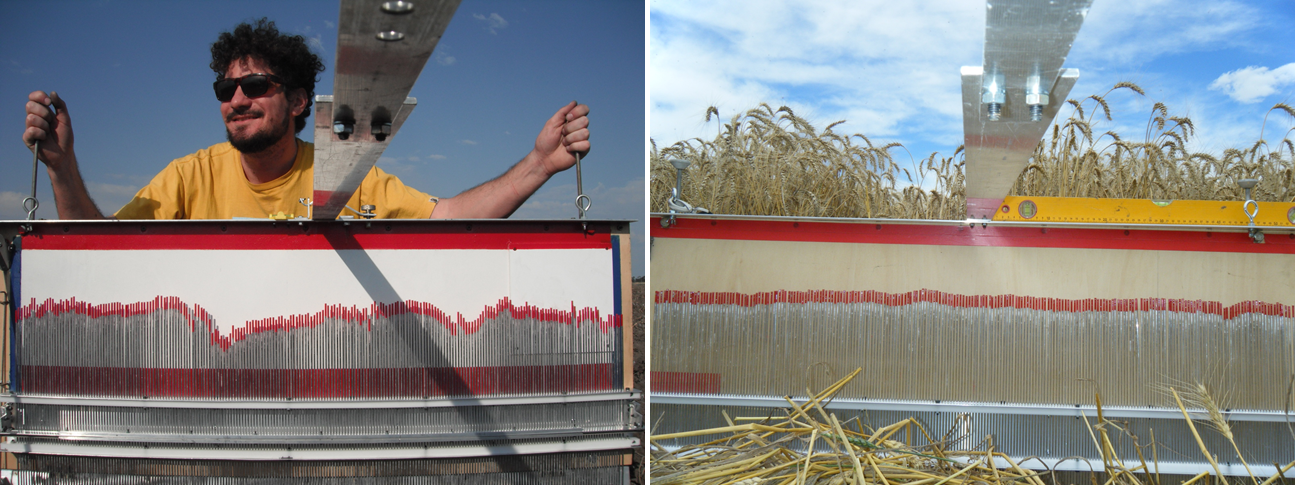
The roughness pin profiler and sampling activitySurface roughness sampling schedule
Focus area
Surface type
Date sampled
Nr.
measurementsYA7
Wheat
04/12
3 YA4
Maize (short)
04/12
1 YA4
Maize (long)
07/12
2 YA4
Pasture type 1
05/12
1 YA4
Pasture type 2
05/12
1 YA4
Pasture type 3
08/12
2 YA4
Cotton
05/12
3 YA4
Barley
05/12
3 YA4
Wheat
08/12
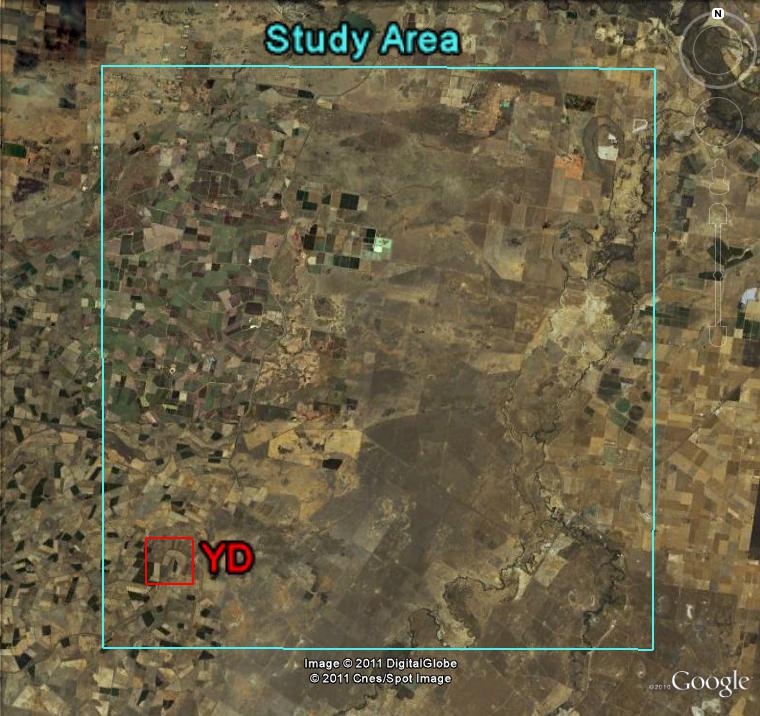
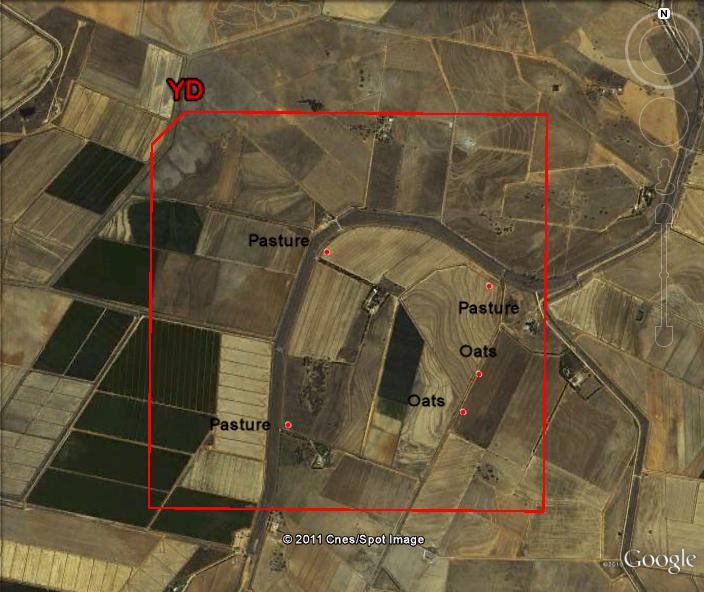
2 YD
Pasture type 1
06/12
2 YD
Pasture type 2
06/12
1 YD
Oats
06/12
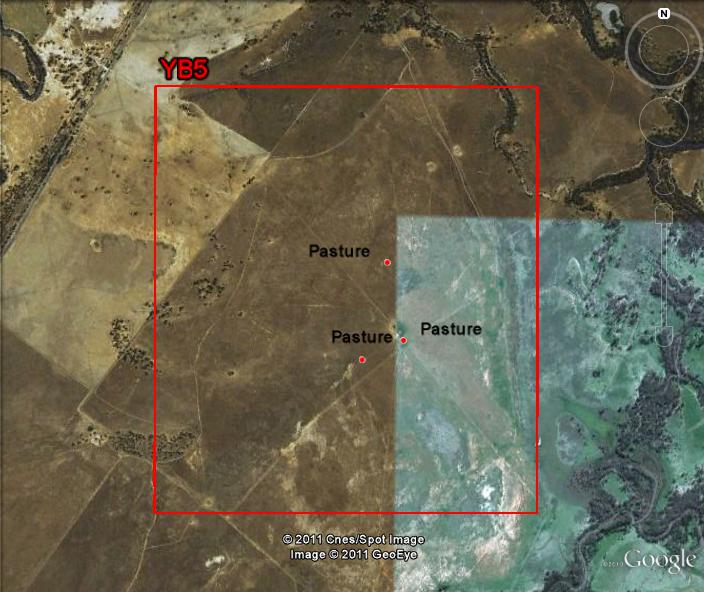
2 YB5
Pasture
07/12
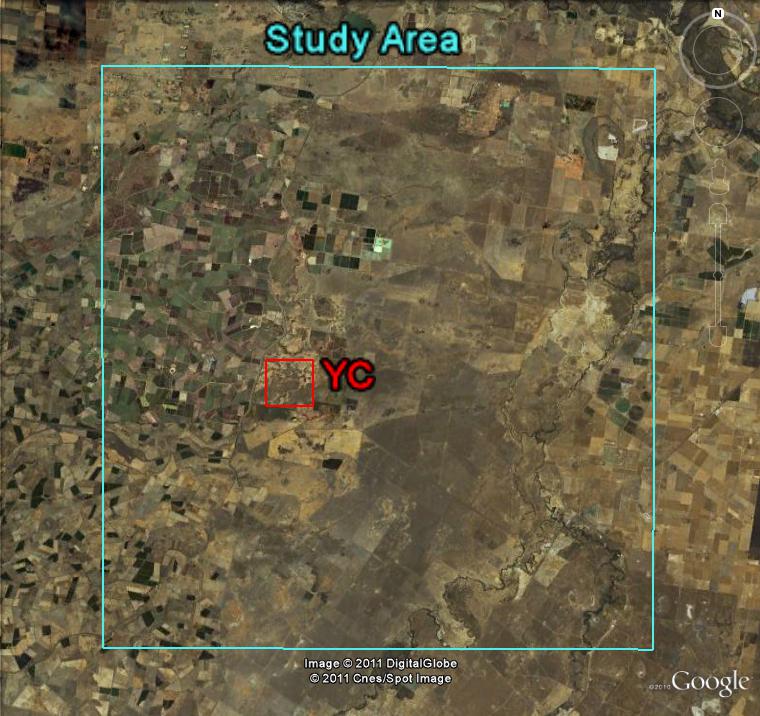
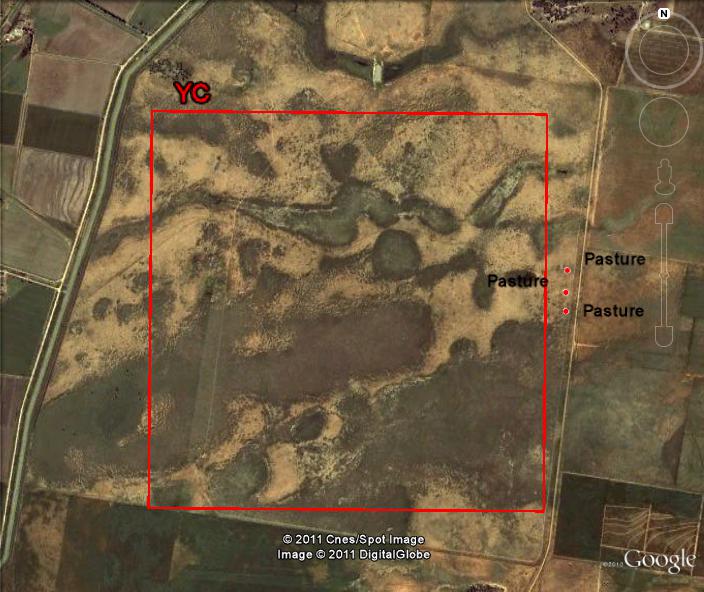
3 YC
Pasture
08/12
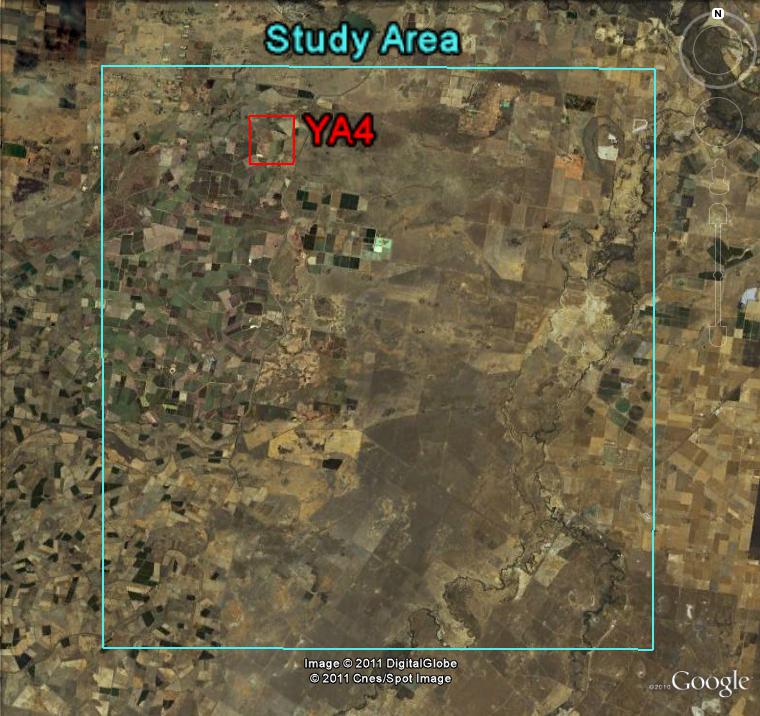
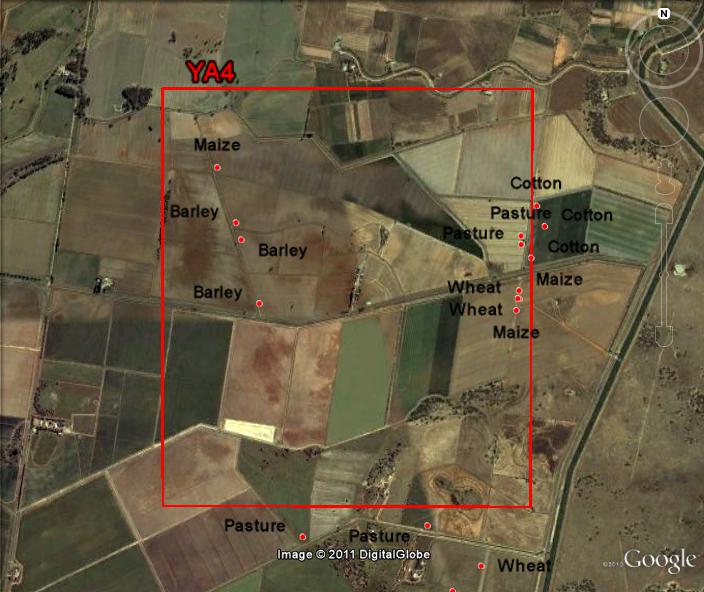
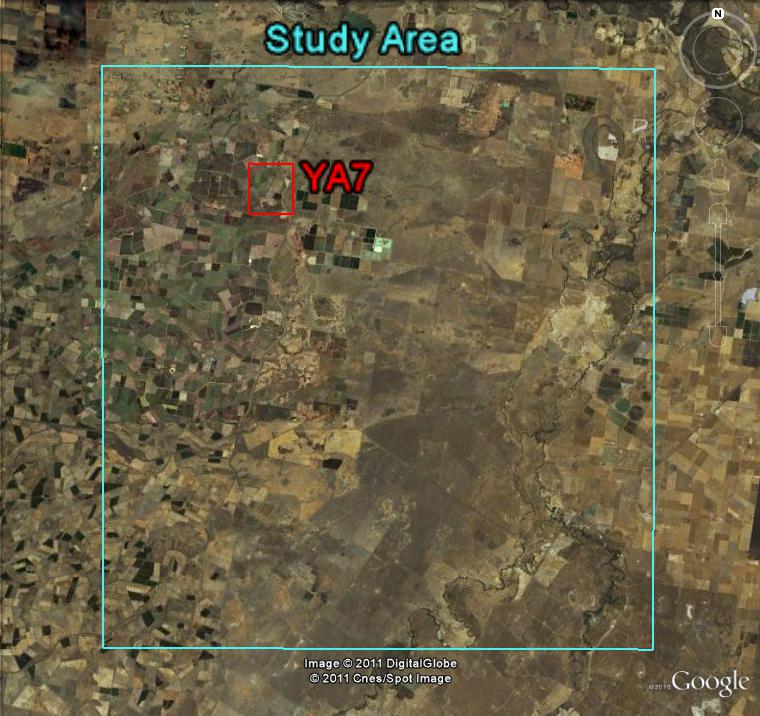
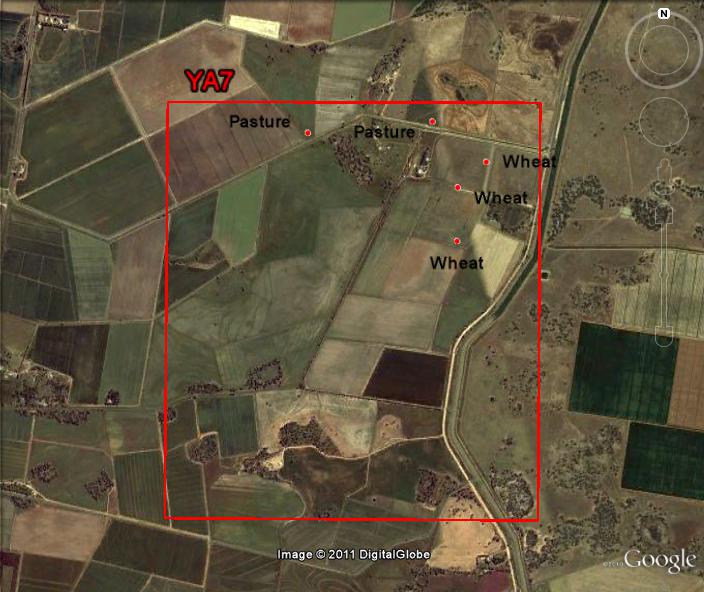
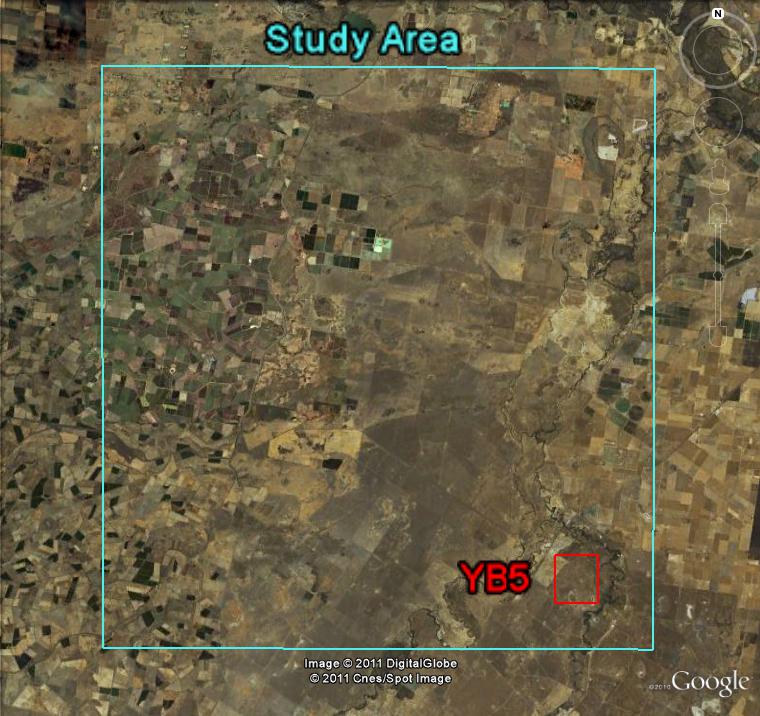
3 Locations of Surface Roughness Sampling Sites
The locations of the surface roughness sampling sites are shown below for each focus area. Users can download all data via the Download Centre.
Surface Roughness Processing
Surface roughness statistics were calculated using the QuiP MATLAB software package. Data were processed as follows:
1. Surface roughness statistics were calculated on the raw profile and are provided in the "one scale" columns (NOTE: correlation length is calculated from the experimental Autocorrelation function)
2. In the cases where multi-scale roughness was observed, spectral analysis was performed to separate the high (microscopic) from the low frequency roughness. All statistics are provided in the "two scale" columns, together with the frequency K (in radians/meter) used to separate the high from the low frequency component of the roughness spectrum by Fourier transform.
3. In the case where a periodic structure was observed, a mathematical function was fitted to model the variation in local incidence angle due to the periodic structure. The average, minimum and maximum of the values of the function parameters for each paddock were derived from the experimental profiles.
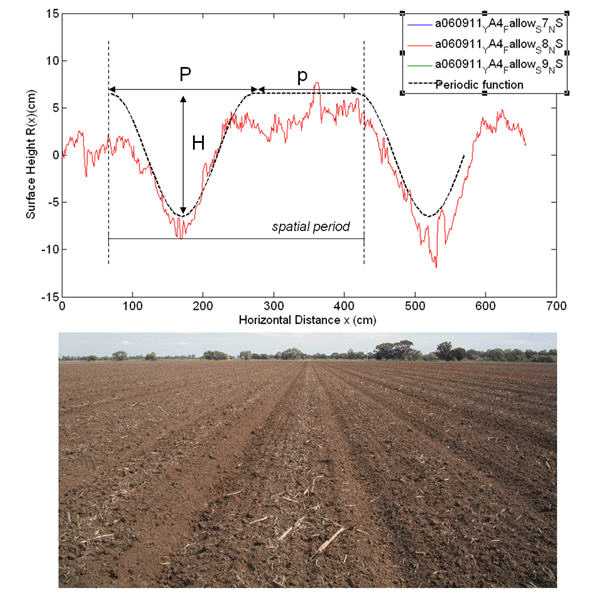
Example of function to model periodic structure